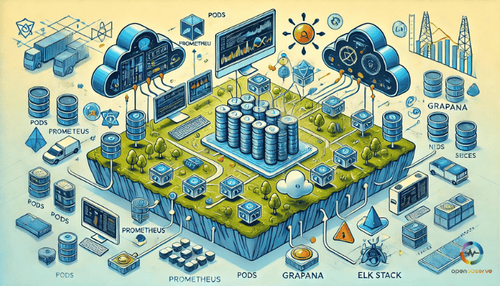
Discover key methods for monitoring Kubernetes like DaemonSets, Heapster and OpenTelemetry for consistent, comprehensive telemetry data.
Full-stack monitoring integrates synthetic and real-user monitoring, metrics, logs, and traces for a comprehensive approach.
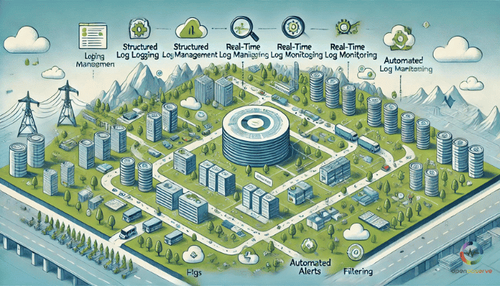
Our blog emphasizes on easier logs management and troubleshooting practices like defining clear logging objectives and structured logs.
Understand the top 10 observability best practices, including monitoring critical events, standardized data logging, and effective feedback loops.
Understand key characteristics of real-time monitoring such as low latency, immediate issue detection and up-to-date data.
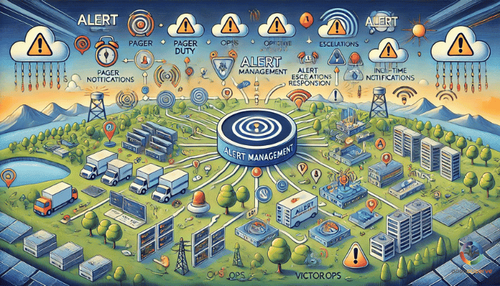
Our guide explores IT alert management essentials, its timely resolution of issues, and its role in enhanced productivity.
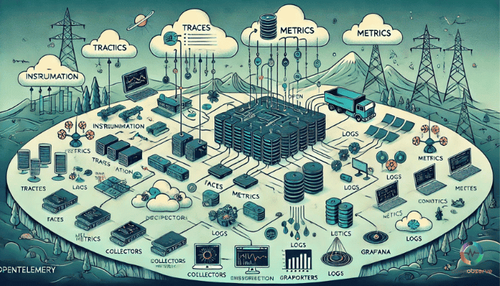
Explore OpenTelemetry architecture, its key components and signals including data collection, processing, and context propagation.
Dynatrace and AppDynamics' comparison highlights key features like APM, AI-driven analytics, user experience monitoring, cost, and pricing models.
Understanding the difference between traces and spans and their roles in distributed tracing enhances debugging and monitoring.
Explore cloud native observability with components like APM, Distributed Tracing, and tools like Prometheus and Jaeger.
Telemetry data involves collection and transmission from devices to central systems, used in IT, healthcare, agriculture, and more.
Understand python -m trace: a method for tracing Python code and function calls for effective debugging and learning.
Distributed tracing allows visibility into microservices-based applications, tracks transactions and identifies performance issues and bottlenecks.
Explore how JavaScript opentelemetry enhances monitoring, tracking, and optimizing application performance in full-stack applications.
Learn about developing an observability strategy, identifying key goals, determining relevant data, and selecting suitable tools and technologies.
OpenTelemetry with Kubernetes Objects Receiver streamlines collecting and monitoring Kubernetes events, enhancing operational reliability and strategic decision-making.
Windows performance counters provide vital parameters in Windows for real-time monitoring - aiding in diagnostics and error resolution.
Discussing elk stack alternatives like Logz.io, Graylog, Logtail due to issues like cost, complex setup and limited customization.
Explore the utility of Fluent Bit with ECS and gain useful configuration tips including debugging, routing records and Lua scripting.
The SQL Query Receiver in OpenTelemetry aids in logs and metrics collection specifically from SQL databases.
Learn to configure OpenTelemetry Collector for JSON logs, specifying telemetry logs encoding as JSON in your setup.