Explore the difference between monitoring and observability and learn how they work together to optimize system performance and reliability.
Uncover top open source logging tools of 2024, with a focus on flexibility, cost-effectiveness, comprehensive features, and support.
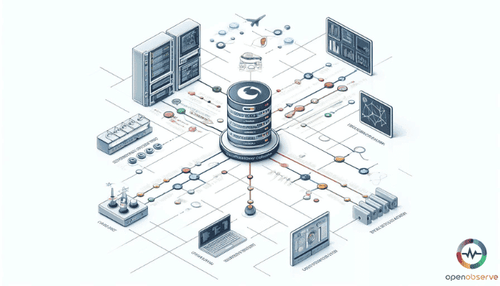
Through logs, metrics, and traces, microservices observability manages the complexities of architecture for reliable, high-performance applications.
Explore the operational frameworks of OTLP, how it contributes to OpenTelemetry data models, and its evolving nature within the OpenTelemetry project.
The blog discusses building an open source observability platform, highlighting key tools like Prometheus, Loki, and OpenTelemetry.
Explore the benefits and components of Syslog servers, how they work, and the importance of log management for system diagnostics.
Uncover osquery, a versatile system monitoring framework that transforms your OS into a queryable relational database, enhancing security and insights.
Boost your website's UX with session replay software. Identify issues, optimize conversions, and enhance support for better performance.
Get started with OTEL collector: setup the environment, generate and collect telemetry, explore components, and apply custom configurations.
Discover how APM tools combat challenges digital teams face, enhancing app performance for businesses and customers.
Explore how OpenTelemetry works, providing standardized collection and analysis of telemetry data like logs, metrics, and traces.
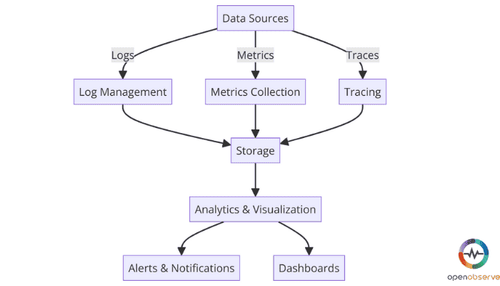
The blog discusses the observability stack, its core pillars and the importance of telemetry data in system performance.
Explore how integrating NGINX Receiver with OpenTelemetry Collector offers enhanced observability solutions.
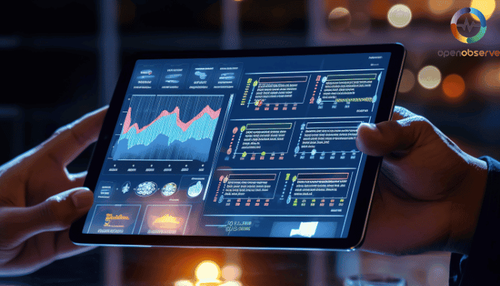
Learn how to optimize asset performance using Prometheus and OpenObserve for real-time monitoring and dynamic dashboard visualization
Explore the unique benefits of Datadog APM for optimizing app performance, resource usage, and security.
Prometheus vs Grafana: Learn how both of these tools compare in crucial metrics like features, data collection and storage, UI, and more.
Setup and configure a Zookeeper Receiver via OpenTelemetry Collector, and get critical monitoring metrics from your Zookeeper installations.
Learn to pull messages from a Google Cloud Pub/Sub Receiver and acknowledgement in our practical guide with examples.
Explore simplified JMX metric collection and precise metric selection with the OpenTelemetry Java agent's JMX Receiver integration.
Learn to install and use InfluxDB Receiver with command line tools for effective database management and operations.
Get started with Jaeger receiver by enabling supported protocols and endpoints, and managing Elasticsearch backend configuration.