Learn how security observability enhances understanding and incident detection, contributing to robust threat protection in cybersecurity.
Master Apache Monitoring setup, elevate performance metrics, and customize your server with the right tools and practices.
Deploy and configure your Kubelet Stats Receiver with OpenTelemetry using this step-by-step guide.
Discover the role and setup of SQL Server Receiver within OpenTelemetry for effective monitoring and performance optimization.
Discover ways to choose the right web application monitoring tools, monitor user experience, and automate alerts for maximum efficiency.
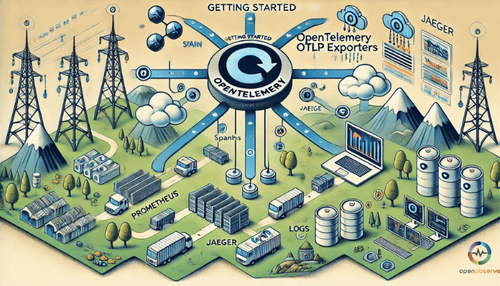
Start with OpenTelemetry OTLP Exporters; an overview, benefits of using them in telemetry, and their importance.
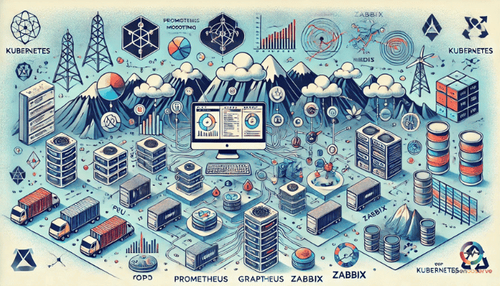
Prometheus is an open-source monitoring tool offering seamless integration with Kubernetes and Grafana for multidimensional data model.
Learn the essential steps to enable istio tracing in microservices and how Istio’s Envoy proxy generates and propagates tracing headers.
Explore how log analysis improves efficiency and enhances security, with an introduction to popular tools like Splunk and ELK Stack.
Learn how to configure Kafka to report metrics to the OpenTelemetry Collector in our in-depth guide for Kafka metrics receiver.
Understand how to use OpenTelemetry to collect and forward Windows Event Log Receiver, specifying log channels for optimal monitoring.
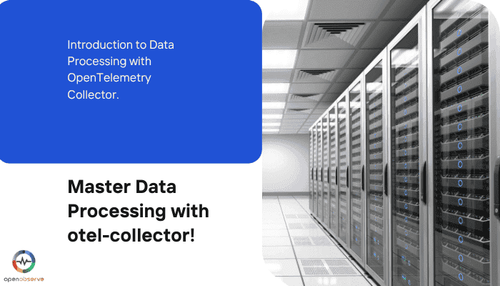
Get an overview of OpenTelemetry Collector's data processing capabilities, its key components like receivers, processors, exporters and extensions.
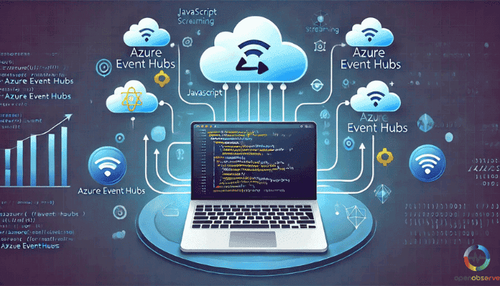
Learn how to authenticate and receive events using Azure Event Hub Receiver in a Javascript application, featuring step-by-step instructions and code examples.
Explore OpenTelemetry's Host Metrics Receiver: Learn prerequisites for installation, configuration nuances, and metrics exporting guidelines.
K8s Cluster Receiver is instrumental in aggregating cluster-level metrics and events for efficient Kubernetes monitoring.
Explore the three pillars of observability—logs, metrics, and traces. Learn how they interact to provide deep system visibility and drive performance.
RUM captures user interaction metrics for proactive issue resolution and digital performance improvement. Understand Real User Monitoring.
This blog introduces the OpenTelemetry Collector for Memcached and details the data collection process for effective Memcached monitoring.
Discover key steps in choosing the right SaaS monitoring tools: consider type of application, performance requirements, and user experience.
Get an overview of SPA Monitoring, its importance in monitoring single page applications, and its eminent advantages for developers.
Get started with Jaeger tracing: understand its role in distributed systems and explore the Jaeger UI for better monitoring.