Posts by Manas Sharma
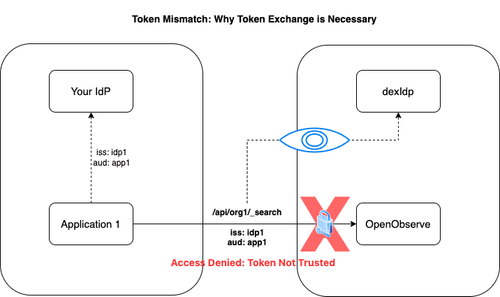
Discover OpenObserve’s Service Accounts feature, designed for secure programmatic access to APIs. Learn how token exchange enhances security and simplifies automation.
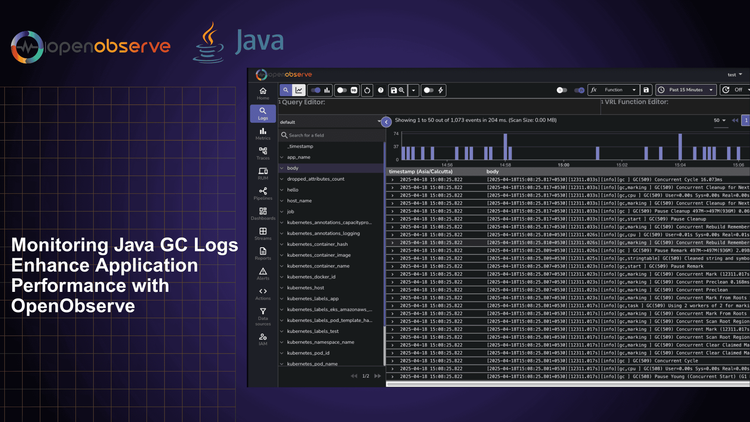
Learn how to leverage Java GC logs to diagnose memory issues, optimize application performance, and prevent production outages. This guide explains how to interpret GC log patterns and use OpenObserve for practical monitoring and analysis.
Learn how to implement effective SNMP monitoring using OpenTelemetry and OpenObserve. Monitor network devices, servers, and infrastructure with real-time insights and improved troubleshooting.
Unlock the full potential of your ArgoCD deployments with Prometheus and OpenObserve monitoring. Get real-time insights into application health, sync status, and reconciliation performance.
Set up comprehensive Windows monitoring with OpenObserve. Collect, analyze, and visualize event logs, performance metrics, and security events for enhanced troubleshooting and system visibility.
Monitor Linux systems with OpenObserve. Learn how to collect and analyze system logs, metrics, and security events for improved system visibility, troubleshooting, and compliance. Get insights into performance monitoring and security with OpenObserve.
Learn how to capture and analyze Amazon EKS Fargate logs using AWS's built-in Fluent Bit log router, Kinesis Firehose, and OpenObserve for comprehensive container monitoring.
Learn how to monitor Docker container metrics using OpenTelemetry and OpenObserve. Collect CPU, memory, network, and disk metrics without modifying your applications.
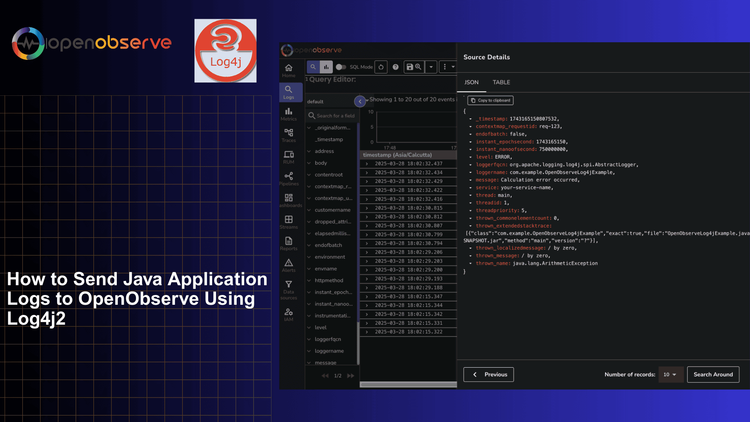
A comprehensive guide to configuring Log4j2 to send structured logs to OpenObserve for centralized logging and analysis of Java applications.
This comprehensive guide walks you through the process of integrating PagerDuty with OpenObserve for effective incident management. You'll learn how to set up a PagerDuty service, create alert templates in OpenObserve, configure webhook destinations, and test your integration. Perfect for DevOps engineers, SREs, and IT professionals looking to streamline their alerting workflow and improve response times to critical issues.
Learn how to configure Datadog Agent to send metrics to OpenObserve using OpenTelemetry Collector. Complete guide with setup, troubleshooting & best practices.
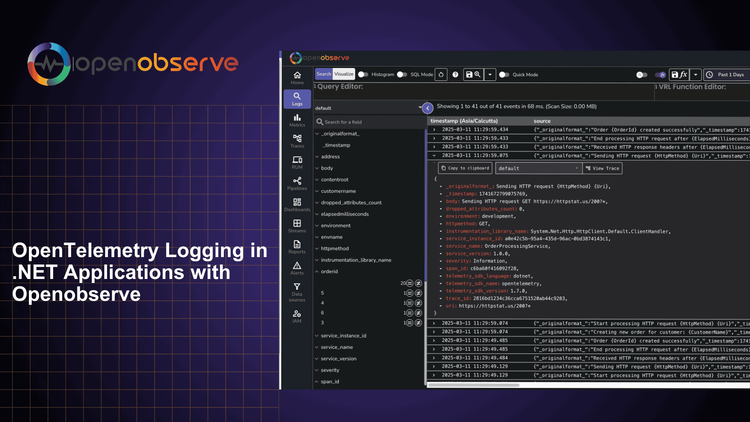
Learn how to implement OpenTelemetry logging in .NET applications using OpenObserve. Step-by-step guide to configure, collect, and analyze logs.
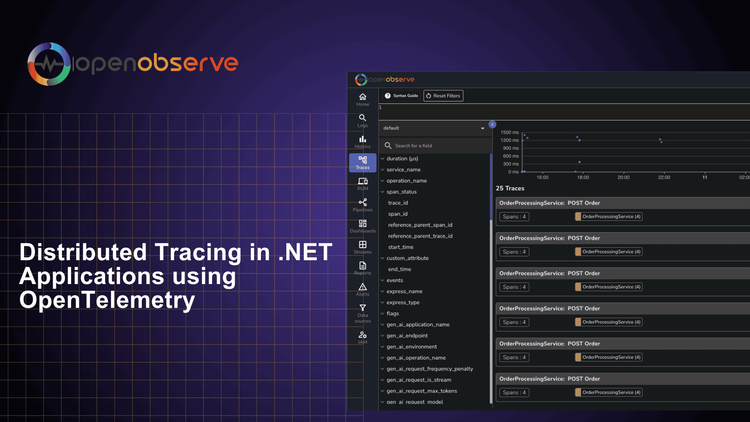
Learn how to implement distributed tracing in your .NET applications using OpenTelemetry. This guide covers the benefits of distributed tracing, how to get started with OpenTelemetry, and best practices for implementation.
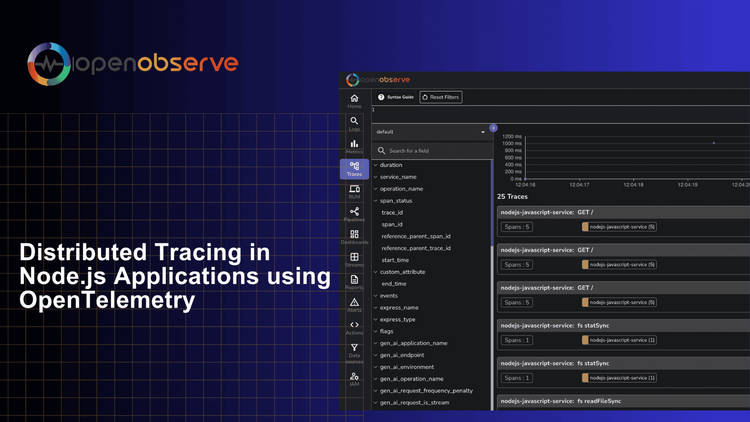
Learn how to implement distributed tracing in your Node.js applications using OpenTelemetry. Complete guide covering auto & manual instrumentation, trace visualization, and monitoring with OpenObserve.
Learn how to effectively monitor RabbitMQ performance metrics using OpenTelemetry Collector. Master message queue monitoring, track broker health, and optimize your messaging infrastructure with our comprehensive guide.
Discover how to integrate OpenObserve and OpenLIT for comprehensive LLM observability, enabling real-time monitoring, tracing, and optimization of AI application performance.
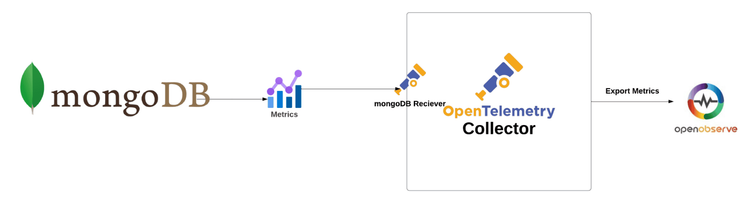
Discover how to effectively monitor MongoDB Metrics using the OpenTelemetry Collector. Enhance performance and reliability with our comprehensive guide.
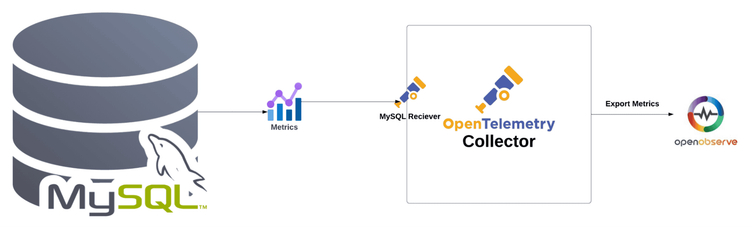
Discover how to effectively monitor MySQL Metrics using the OpenTelemetry Collector. Enhance performance and reliability with our comprehensive guide.
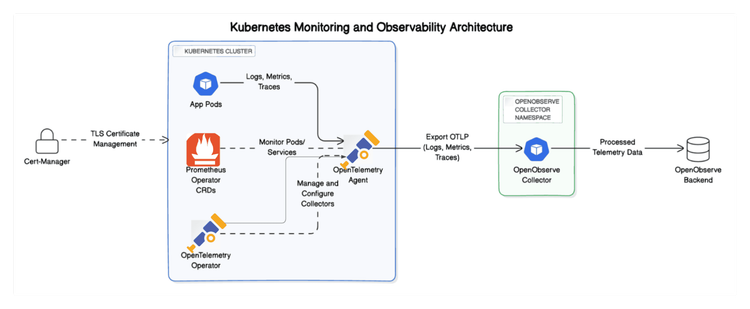
Discover how Opentelemetry & OpenObserve simplifies Kubernetes monitoring. Enhance visibility, performance, and troubleshooting for your Kubernetes Enviornment.
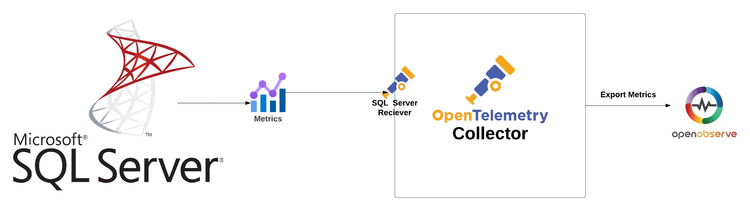
Boost SQL Server performance with OpenTelemetry! Discover top monitoring techniques for seamless database management and enhanced efficiency today
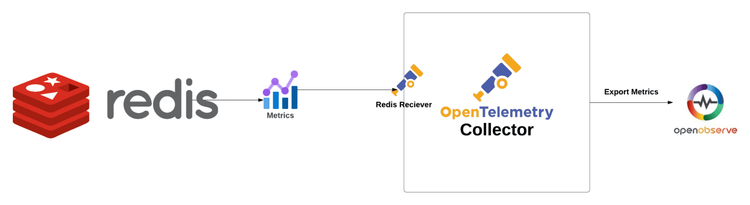
Discover how to effectively monitor Redis Metrics using the OpenTelemetry Collector. Enhance performance and reliability with our comprehensive guide.