Explore latest insights and updates
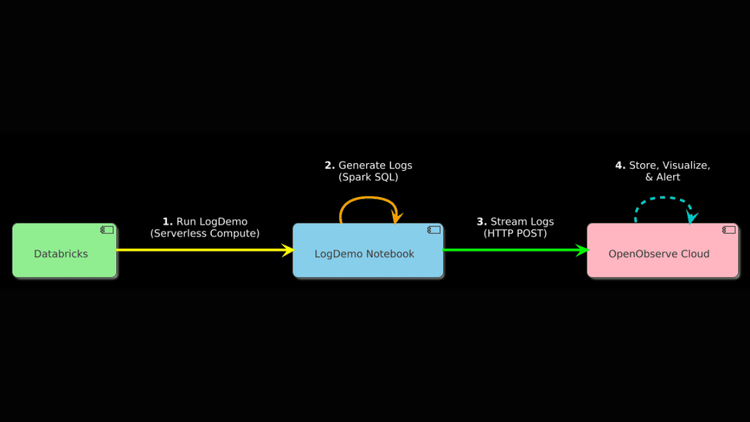
This guide explains how to monitor Databricks logs in real time using OpenObserve.
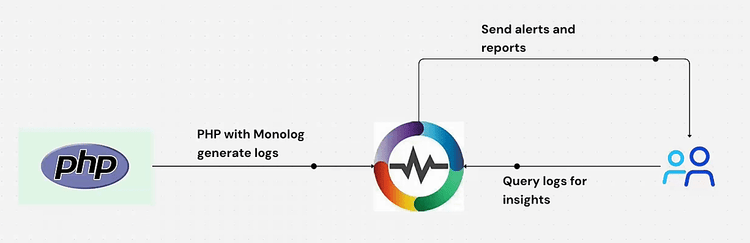
Learn how to boost PHP application observability by integrating Monolog with OpenObserve for powerful log management. This step-by-step guide shows developers how to implement real-time error tracking, performance monitoring, and troubleshooting capabilities using structured logging techniques that scale with your application. Perfect for PHP developers looking to enhance application reliability and gain actionable insights from their logs.
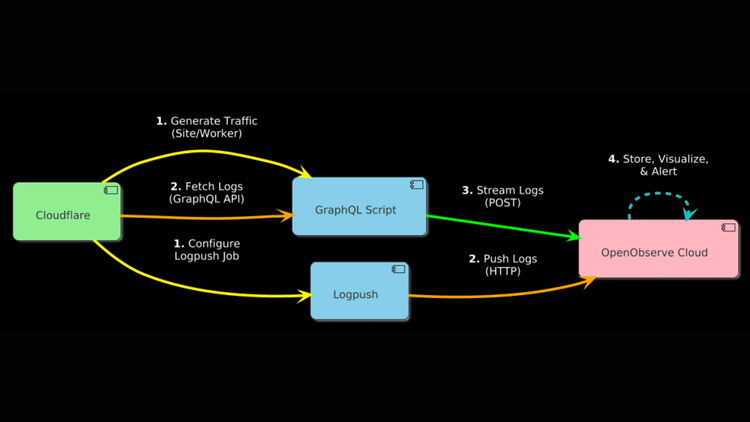
This guide demonstrates how to stream Cloudflare HTTP request logs to OpenObserve using GraphQL API polling or Logpush HTTP push.
This comprehensive guide walks you through the process of integrating PagerDuty with OpenObserve for effective incident management. You'll learn how to set up a PagerDuty service, create alert templates in OpenObserve, configure webhook destinations, and test your integration. Perfect for DevOps engineers, SREs, and IT professionals looking to streamline their alerting workflow and improve response times to critical issues.
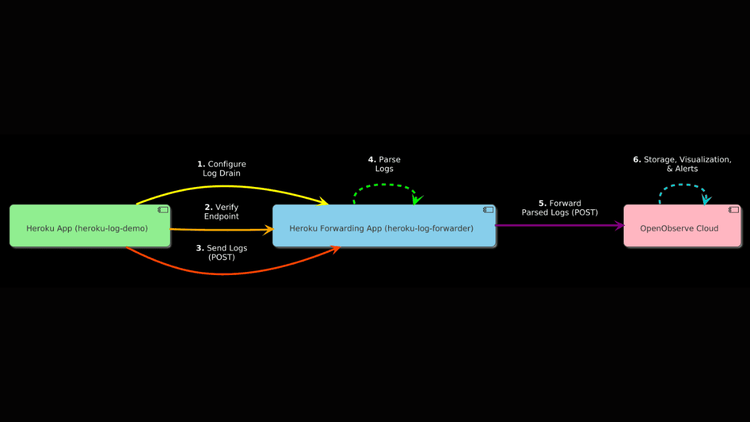
Learn how to set up Heroku Log Drains to seamlessly send logs to OpenObserve using a forwarding app.
Learn how to configure Datadog Agent to send metrics to OpenObserve using OpenTelemetry Collector. Complete guide with setup, troubleshooting & best practices.
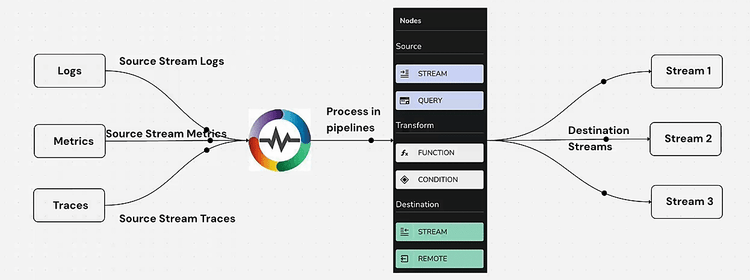
Discover how OpenObserve Pipelines enable real-time log processing, dynamic data routing, and pre-aggregation for optimized observability. Learn to transform raw logs into structured formats using VRL functions, efficiently route logs based on conditions, and pre-aggregate metrics to improve performance. This in-depth guide covers step-by-step implementation, from ingesting logs to building powerful OpenObserve Pipelines for seamless log management and analytics. Perfect for DevOps, SREs, and observability engineers looking to enhance log processing workflows.
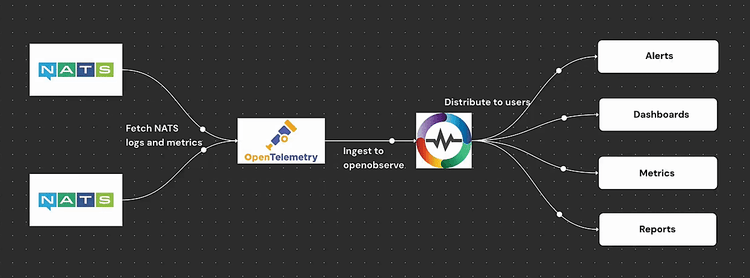
Boost your NATS infrastructure reliability with comprehensive observability. This guide covers log collection, metric analysis, visualization tools, and best practices for effective monitoring.
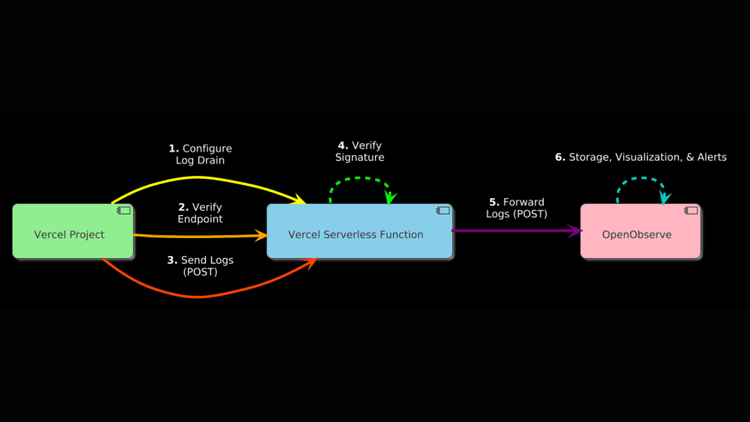
Learn how to set up Vercel Log Drains to seamlessly send logs to OpenObserve using a serverless function.
An observability case study showcasing how a leading IoT-based supply chain visibility platform revolutionized its monitoring infrastructure.
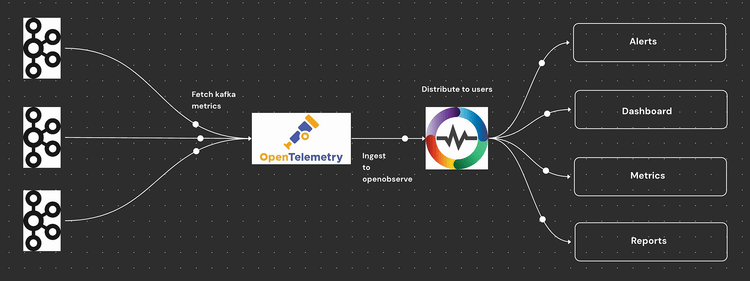
Learn how to monitor Apache Kafka metrics effectively using OpenTelemetry Collector Contrib and OpenObserve. This detailed guide covers Kafka installation, setting up OpenTelemetry for real-time Kafka monitoring, configuring dashboards, and tracking key Kafka metrics like brokers, consumer groups, partition offsets, replicas, and message rates. Discover the benefits of monitoring Kafka with OpenObserve, including automated alerts, performance insights, and data integrity checks. Optimize your Kafka infrastructure with proactive monitoring and real-time observability—boost system reliability, detect issues early, and scale efficiently.
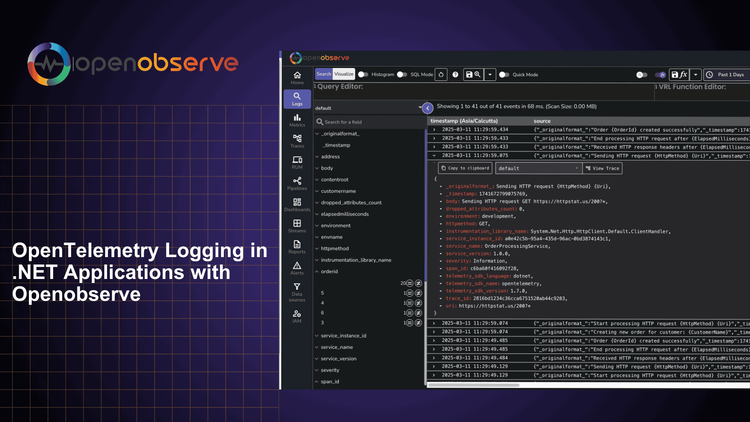
Learn how to implement OpenTelemetry logging in .NET applications using OpenObserve. Step-by-step guide to configure, collect, and analyze logs.
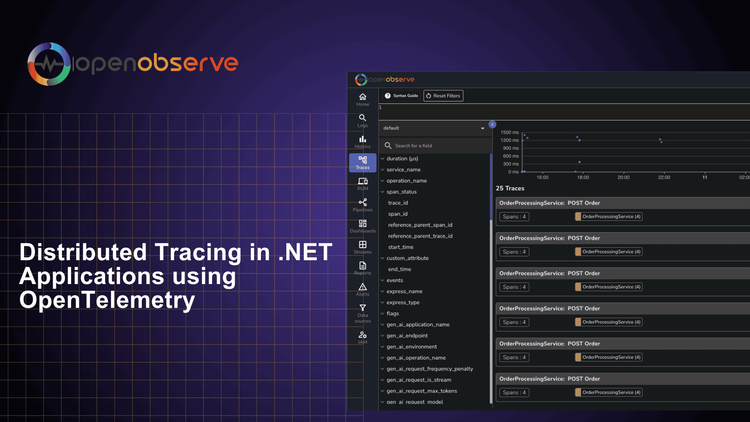
Learn how to implement distributed tracing in your .NET applications using OpenTelemetry. This guide covers the benefits of distributed tracing, how to get started with OpenTelemetry, and best practices for implementation.
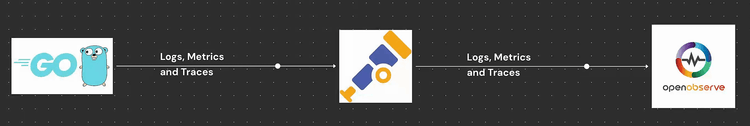
Learn how to implement distributed tracing in Go applications using OpenTelemetry. This comprehensive guide covers auto and manual instrumentation, correlating traces, metrics, and logs, and visualizing data in OpenObserve for complete observability.
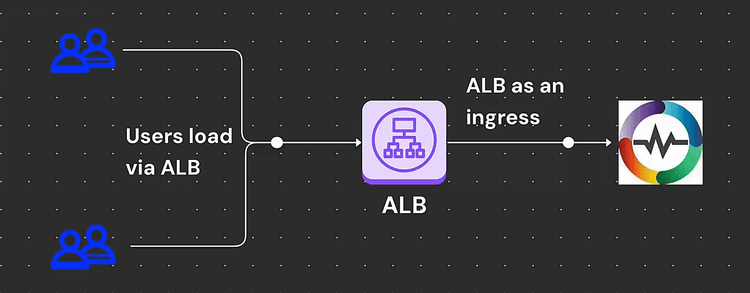
Learn How to deploy OpenObserve on Amazon EKS with ALB ingress. Step-by-step guide on setup, for better security, performance, and compliance.
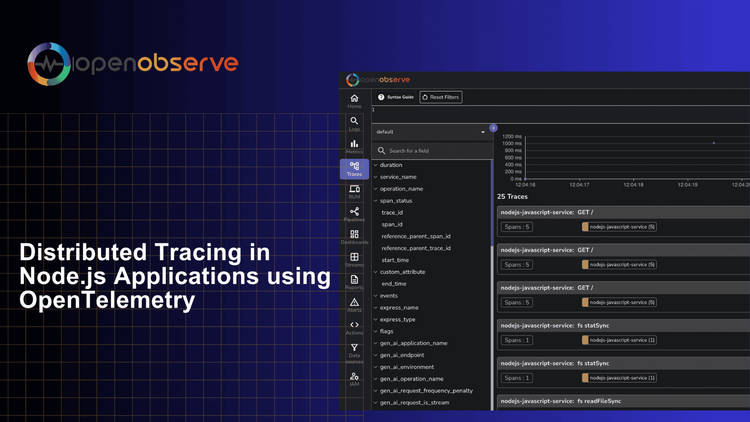
Learn how to implement distributed tracing in your Node.js applications using OpenTelemetry. Complete guide covering auto & manual instrumentation, trace visualization, and monitoring with OpenObserve.
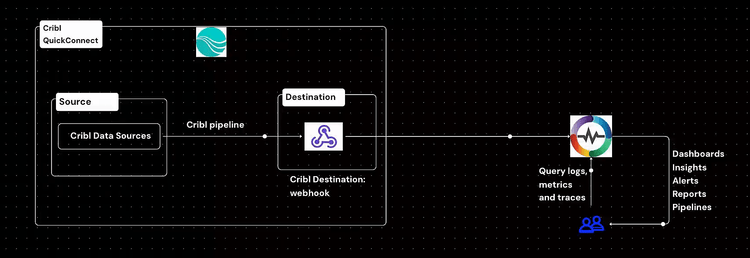
Learn how to integrate Cribl, a powerful data engine, with OpenObserve for efficient log and trace ingestion. Step-by-step setup, webhook configuration, and monitoring included.
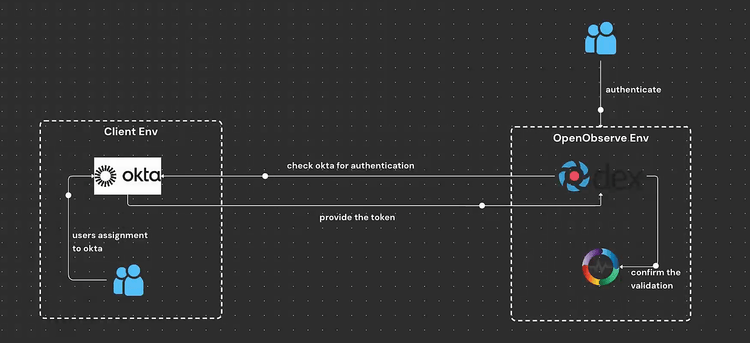
Learn how to configure Okta SSO with OpenObserve Dex using OAUTH for seamless authentication. Discover why Dex simplifies identity management, and follow a step-by-step guide to set up Azure AD authentication with Dex. Enhance security, streamline user access, and optimize performance with this modern authentication approach.
Learn how to effectively monitor RabbitMQ performance metrics using OpenTelemetry Collector. Master message queue monitoring, track broker health, and optimize your messaging infrastructure with our comprehensive guide.
Discover how to integrate OpenObserve and OpenLIT for comprehensive LLM observability, enabling real-time monitoring, tracing, and optimization of AI application performance.
An observability case study demonstrating how a leading no-code automation platform revolutionized its monitoring infrastructure