Explore latest insights and updates
Enhance your understanding of error handling in Python with OpenTelemetry. This detailed guide offers step-by-step instructions to use Global Error Handler in Otel Python SDK.
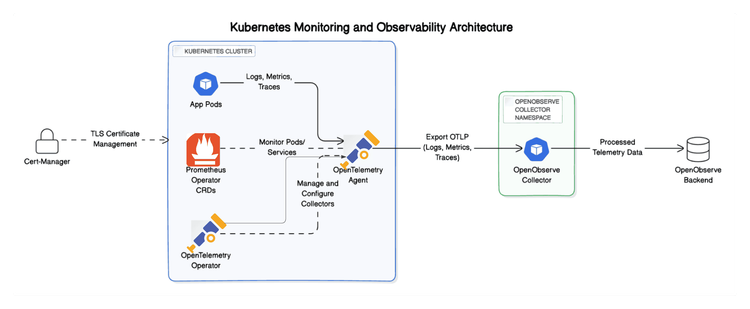
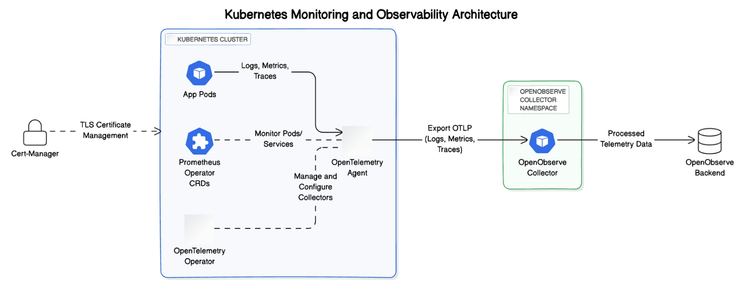
Enhance your Kubernetes observability using OpenTelemetry and Prometheus. TargetAllocator optimizes target discovery, ensuring reliable monitoring in dynamic settings.
Learn everything about Windows IIS logging, from setup and configuration to log collection and parsing. Enhance your understanding and improve your IIS log management with step-by-step instructions and practical examples.
Discover everything you need to know about Prometheus metrics, from its architecture and setting up efficient metrics collection to optimizing and visualizing data for scalable observability. This guide covers how to leverage Prometheus for insightful monitoring, making it easier to ensure system performance and reliability at scale. Perfect for DevOps engineers and observability enthusiasts, this blog provides actionable insights on maximizing Prometheus capabilities to enhance your infrastructure monitoring.
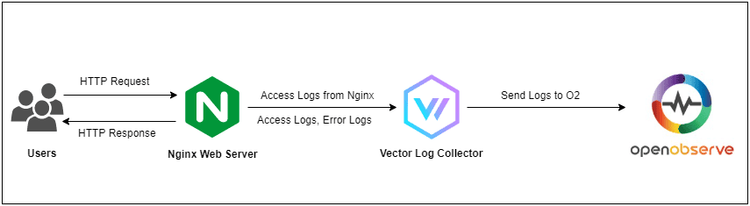
Learn how to monitor Nginx logs in real-time with this step-by-step guide, covering essential techniques for tracking logs, metrics, and performance insights. Discover best practices to optimize Nginx performance, troubleshoot issues faster, and ensure high availability by gaining actionable visibility into your web server’s health.
Learn how to monitor Jenkins pipelines effectively with this comprehensive guide on integrating OpenTelemetry and OpenObserve. Discover step-by-step instructions for capturing Jenkins logs, metrics, and traces to enhance CI/CD observability and optimize pipeline performance.
Learn how to store and monitor Ansible logs effortlessly with this step-by-step guide. Discover best practices for Ansible log management, setup instructions, and tips for using Fluent Bit to centralize logs for real-time monitoring and troubleshooting.
Discover the essential guide to Jaeger and learn how distributed tracing can elevate your modern applications. Ideal for DevOps professionals and developers, this guide unlocks insights for better performance, troubleshooting, and system optimization.
Learn how to generate, configure, and ingest Terraform logs with Fluent Bit to OpenObserve. This step-by-step guide covers essential logging for auditing, troubleshooting, and optimizing your infrastructure, ensuring comprehensive visibility and compliance in your infrastructure-as-code deployments.
Discover the latest release of OpenObserve, version 0.13.1-rc1! Enjoy faster search speeds, advanced dashboard features, enhanced alerting with multiple time range and VRL support, and optimized performance. Experience next-level observability with these powerful updates and more in OpenObserve 0.13.1-rc1.
Learn how to enhance AWS VPC Flow Logs by adding reverse DNS resolution using Vector Remap Language (VRL). This guide provides a step-by-step approach to implementing reverse DNS lookups, enriching log data with domain information for improved network visibility and security insights.
Unlock real-time insights for DevOps with efficient Kubernetes log streaming. Discover how to streamline logging and enhance observability for optimized performance and rapid troubleshooting in Kubernetes environments.
Explore the importance of Real User Monitoring (RUM) and learn how OpenObserve enhances RUM with powerful observability features. This guide walks you through building a React User Portal and integrating OpenObserve RUM to track frontend performance metrics and user interactions for optimized insights.
This blog guides you through effective Nginx log management and analysis using OpenObserve and Vector, providing insights on enhancing observability and streamlining your logging process.
Discover how to implement effective microservices observability using logs, metrics, and traces. Learn key strategies to improve system performance, troubleshoot issues, and optimize your distributed architecture.
Discover how to choose the best SaaS monitoring solution for your organization. Learn key features, best practices, and ROI considerations in this comprehensive guide.
Learn how to create effective monitoring dashboards with OpenObserve. This guide covers installation, sample data setup, and dashboard creation, highlighting key features like customizable panels and dynamic filtering for enhanced application performance monitoring.
This blog helps you in getting started with understanding migration from ELK to OpenObserve Streamlining Log Management for Better Insights.
How to configure journald.conf to customize journald logging in Linux
journald and syslog are two popular logging systems used in Linux environments. While they share some similarities, they have distinct differences in their design, functionality, and use cases.
What is Journald, what is it's log file location, how to do log rotation for it. Also learn how OpenObserve uses otel-collector to provide centralized logging for Journald.


![Building Monitoring Dashboards with OpenObserve [Tutorial]](https://openobserve-staging-website.s3.us-west-2.amazonaws.com/assets/medium_image16_fabb63f803.png)