SLO-Driven Monitoring: Build Better Alerts with OpenObserve

Simran Kumari
July 09, 2025
10 min read
Don’t forget to share!
Anyone who's been on-call knows the drill: it's 3 AM, your phone buzzes, and you're thrown into yet another firefight. Is it a real outage or just another flaky alert? Too often, engineering teams are buried in noise - reactive, unfocused, and overloaded.
The root issue? Many teams lack the ability to prioritize anomalous system behavior, defaulting instead to treating all abnormalities with the same emergency protocol. Fortunately, there’s a technique to address this!
Service Level Objectives (SLOs) address that gap by framing reliability around user expectations rather than traditional infrastructure metrics. They shift the focus from system metrics to user experience. Instead of treating all alerts equally, SLOs help you prioritize what actually matters.
Service Level Objectives (SLOs) are measurable targets for reliability and performance, usually tied to Service Level Indicators (SLIs) like:
Instead of saying, “this server shouldn’t go above 80% CPU,” SLOs help you say: “99% of login requests should complete in under 200ms.”
That framing matters. It keeps the focus where it belongs: the user experience.
SLOs are a valuable tool for developers as well as SREs. They help developers:
By grounding your reliability goals in user experience, not infrastructure metrics, you’ll spend less time guessing, and more time shipping confidently.
OpenObserve doesn’t come with native SLO dashboards (yet), but it gives you everything you need to build one yourself. You can define, monitor, and alert on SLOs using its flexible and powerful building blocks:
In this demo, we’ll apply SLOs to this real-world scenario: monitoring disk utilization on a database server. Rather than using a basic threshold like: "Trigger an alert if disk usage exceeds 80%", we’ll define a more meaningful service-level objective: "To maintain fast and reliable data access, 99% of disk operations should occur while utilization stays under 80% over any 5-minute window."
| Step | Description |
|---|---|
| Set Up Prerequisites | Ensure OpenObserve instance and alert destinations are configured |
| Ingest Metrics Data | Generate and ingest sample disk utilization metrics |
| Configure SLO Alert Rule | Define alert conditions using SQL query |
| Update Message Template | Customize alert message with dynamic values |
| Test Setup | Monitor alerts and verify notifications |
Before we dive into the demo, make sure you have the following set up:
A running OpenObserve instance
Either self-hosted or an OpenObserve Cloud account.
→ Self-hosting Guide
→ Try OpenObserve Cloud
At least one alert destination configured
You'll need this to receive alerts (e.g., Slack, email, webhook).
→ Alert Destinations Setup
Alert templating enabled (recommended)
This allows you to use dynamic values like {{host}} in alert messages.
→ Templating Reference
OpenObserve supports multiple ways to ingest metrics, including native Prometheus scraping, JSON-based ingestion, and REST API endpoints.
Reference: Ingesting Metrics into OpenObserve (Prometheus-style)
While production systems typically use Prometheus exporters or agents to send metrics automatically, for this demo, we’ll generate sample metrics manually and ingest them via the OpenObserve API.
Generate sample SLO metrics data
To simulate disk utilization metrics (e.g., for a database server), use the script available in the OpenObserve GitHub repository: Generate SLO Metrics Script on GitHub
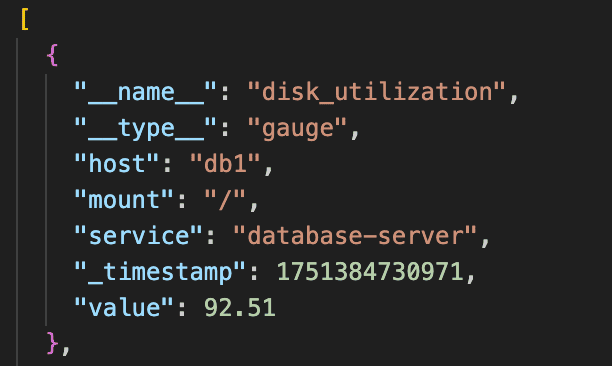
This script generates metrics data over a 5-minute window, with one data point roughly every 10 seconds, across two hosts (db1, db2) and two mount points (/, /data).
Note: OpenObserve stores timestamps in UTC. Always convert your local time accordingly when ingesting custom data manually.
Sample data:
Once generated, ingest it into OpenObserve using:
curl -X POST "http://your-openobserve-host:5080/api/default/ingest/metrics/_json" \
  -H "Authorization: Basic <base64-creds>" \
  -H "Content-Type: application/json" \
  --data-binary @slo_metrics_data.json
Replace:
your-openobserve-host with your actual OpenObserve endpoint
<base64-creds> with your Authentication token.
``

Add alert button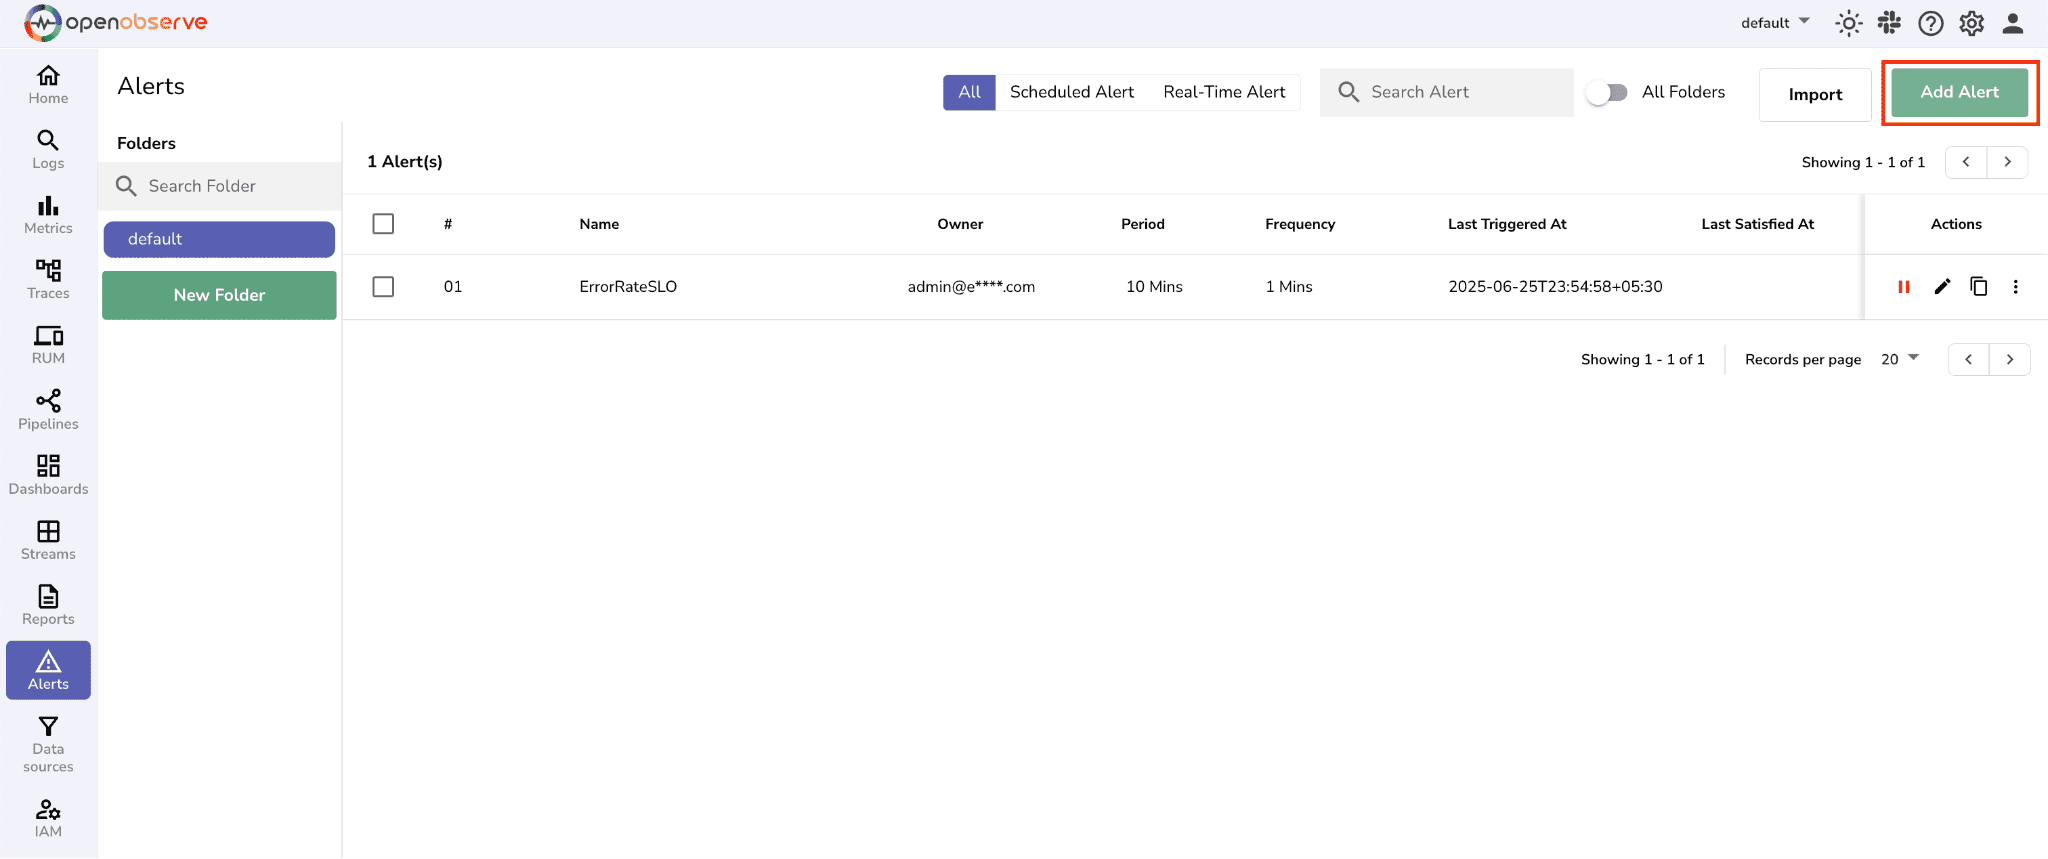 2. Fill in Alert-Setup details:
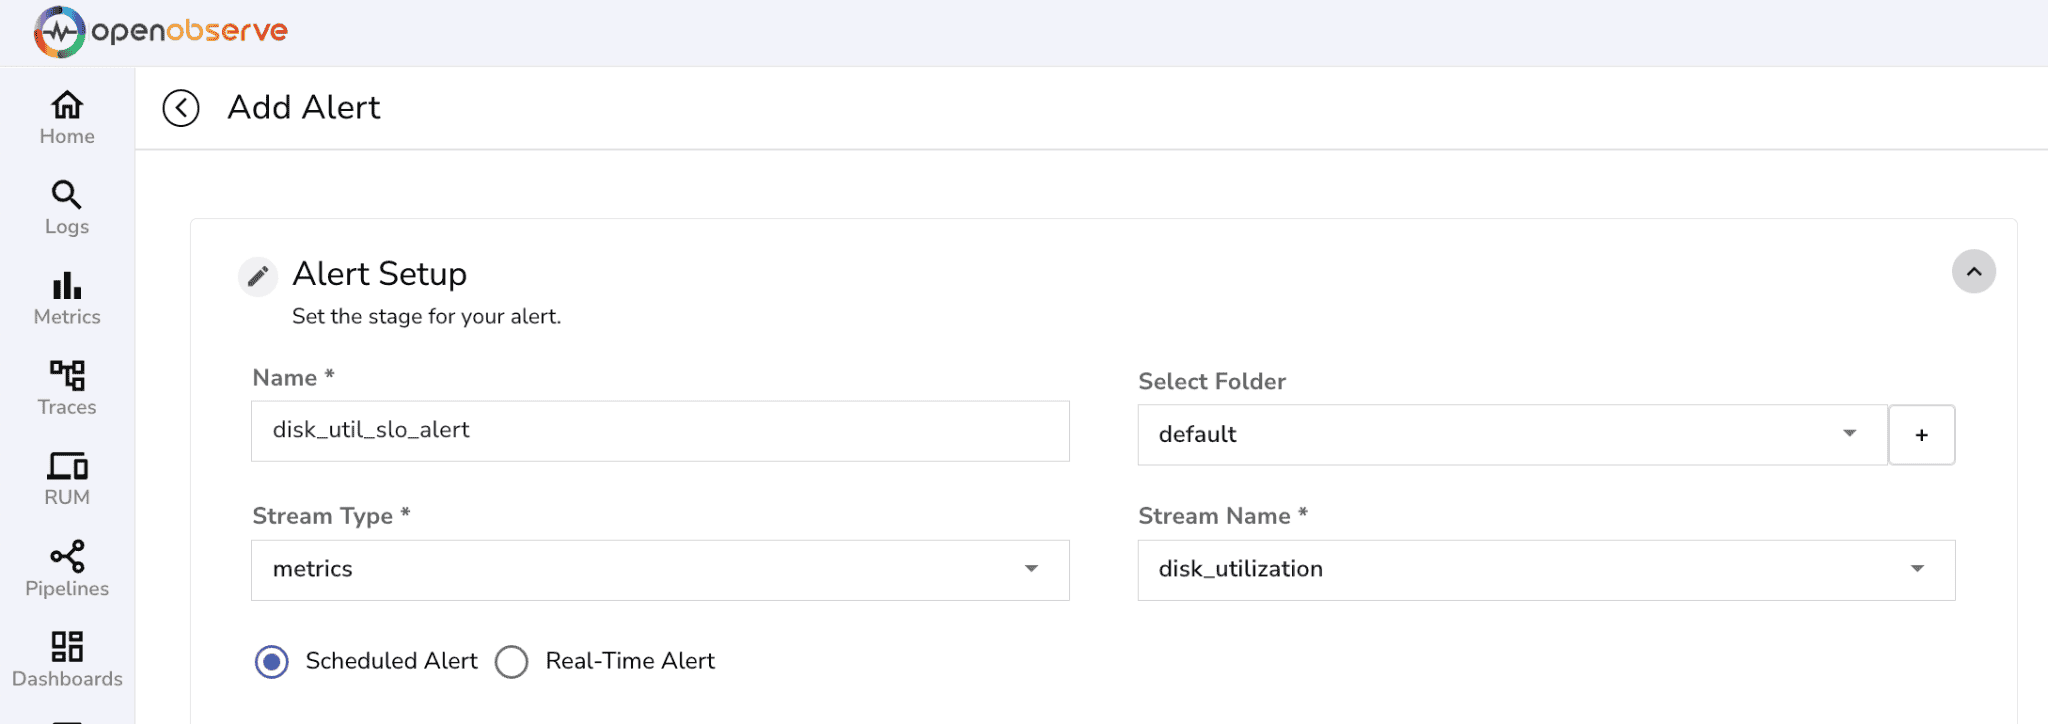
Give the alert a meaningful name
Choose stream type as metrics
Select stream data as disk_utilization from the dropdown
Set alert type to Scheduled Alert, since we want to evaluate data aggregated over a 5-minute period instead of triggering alerts in real-time
Configure alert Settings. Select the corresponding destination where you want to receive the alert notification.
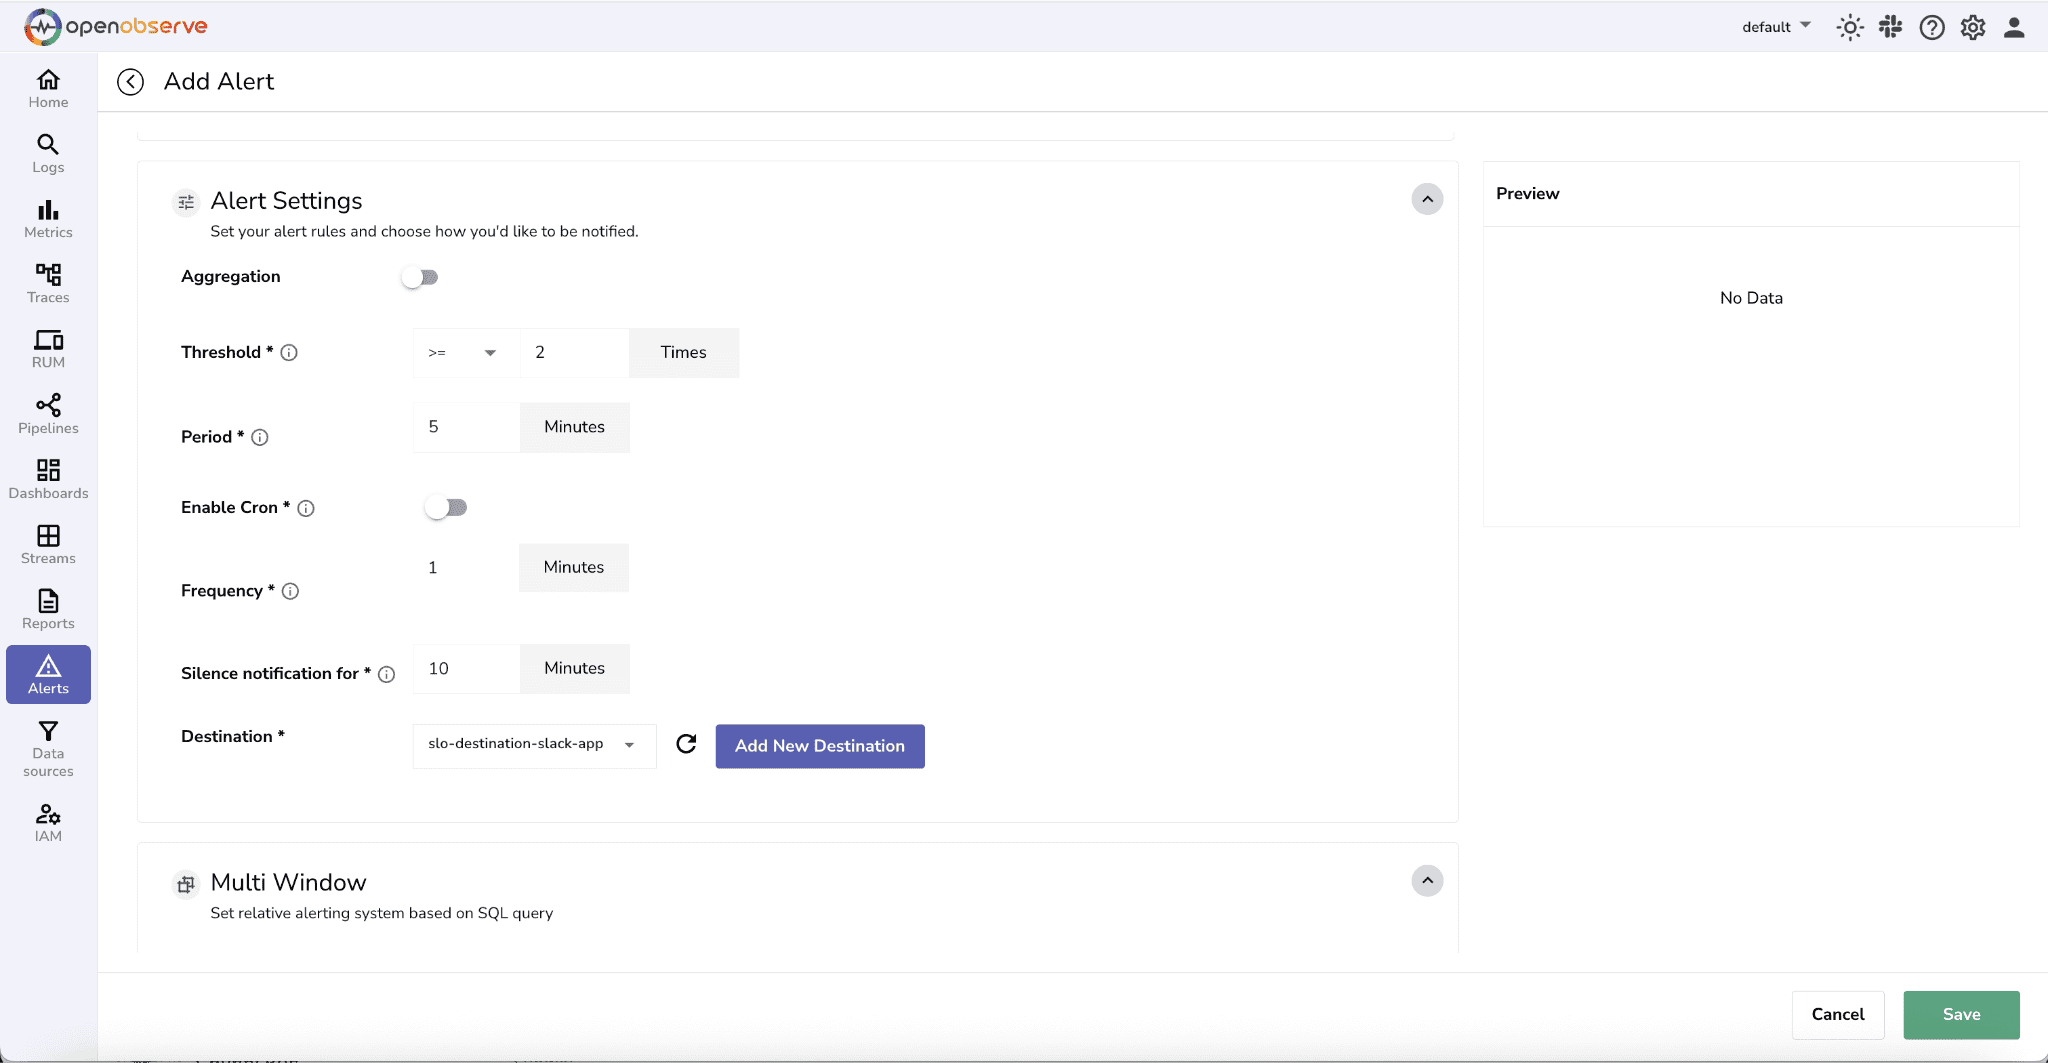 Refer to OpenObserve Alert Concepts to understand the parameters or click on the `i` icon for details.
 4. Next, we need to set conditions for alert.
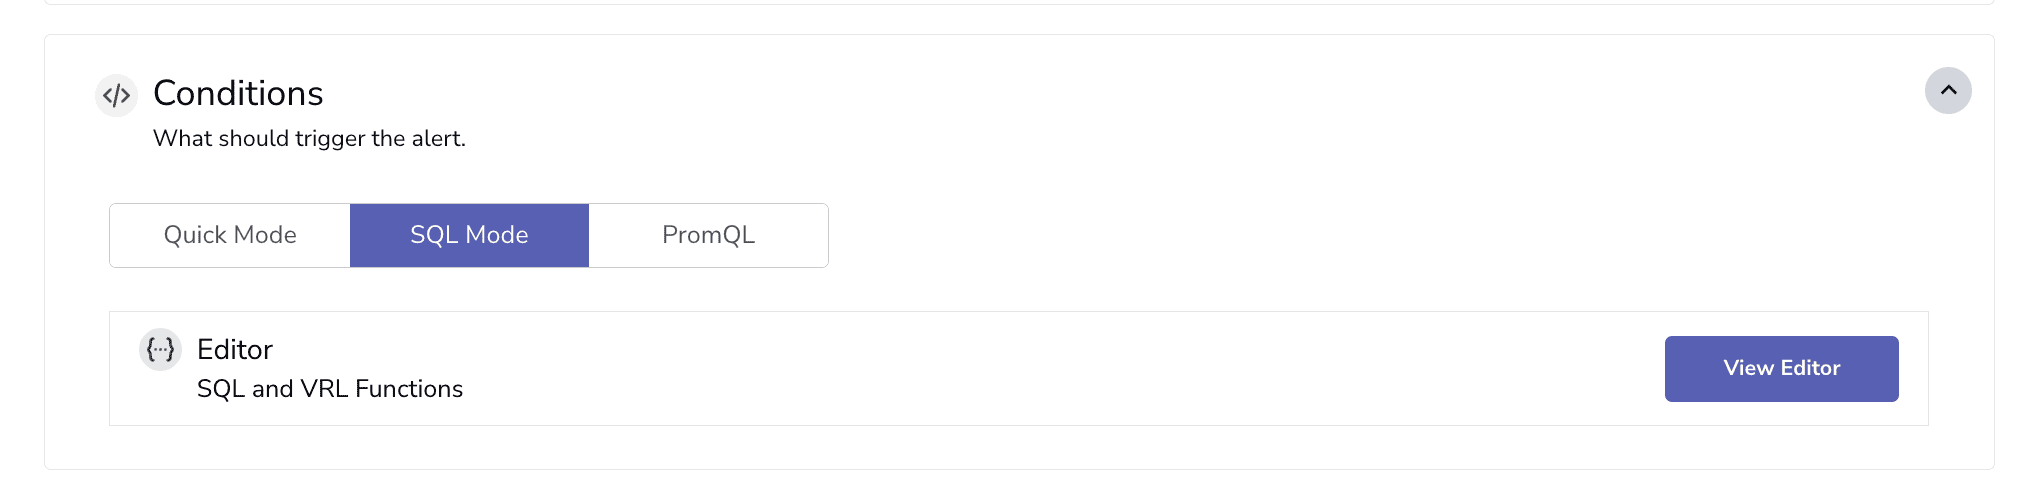
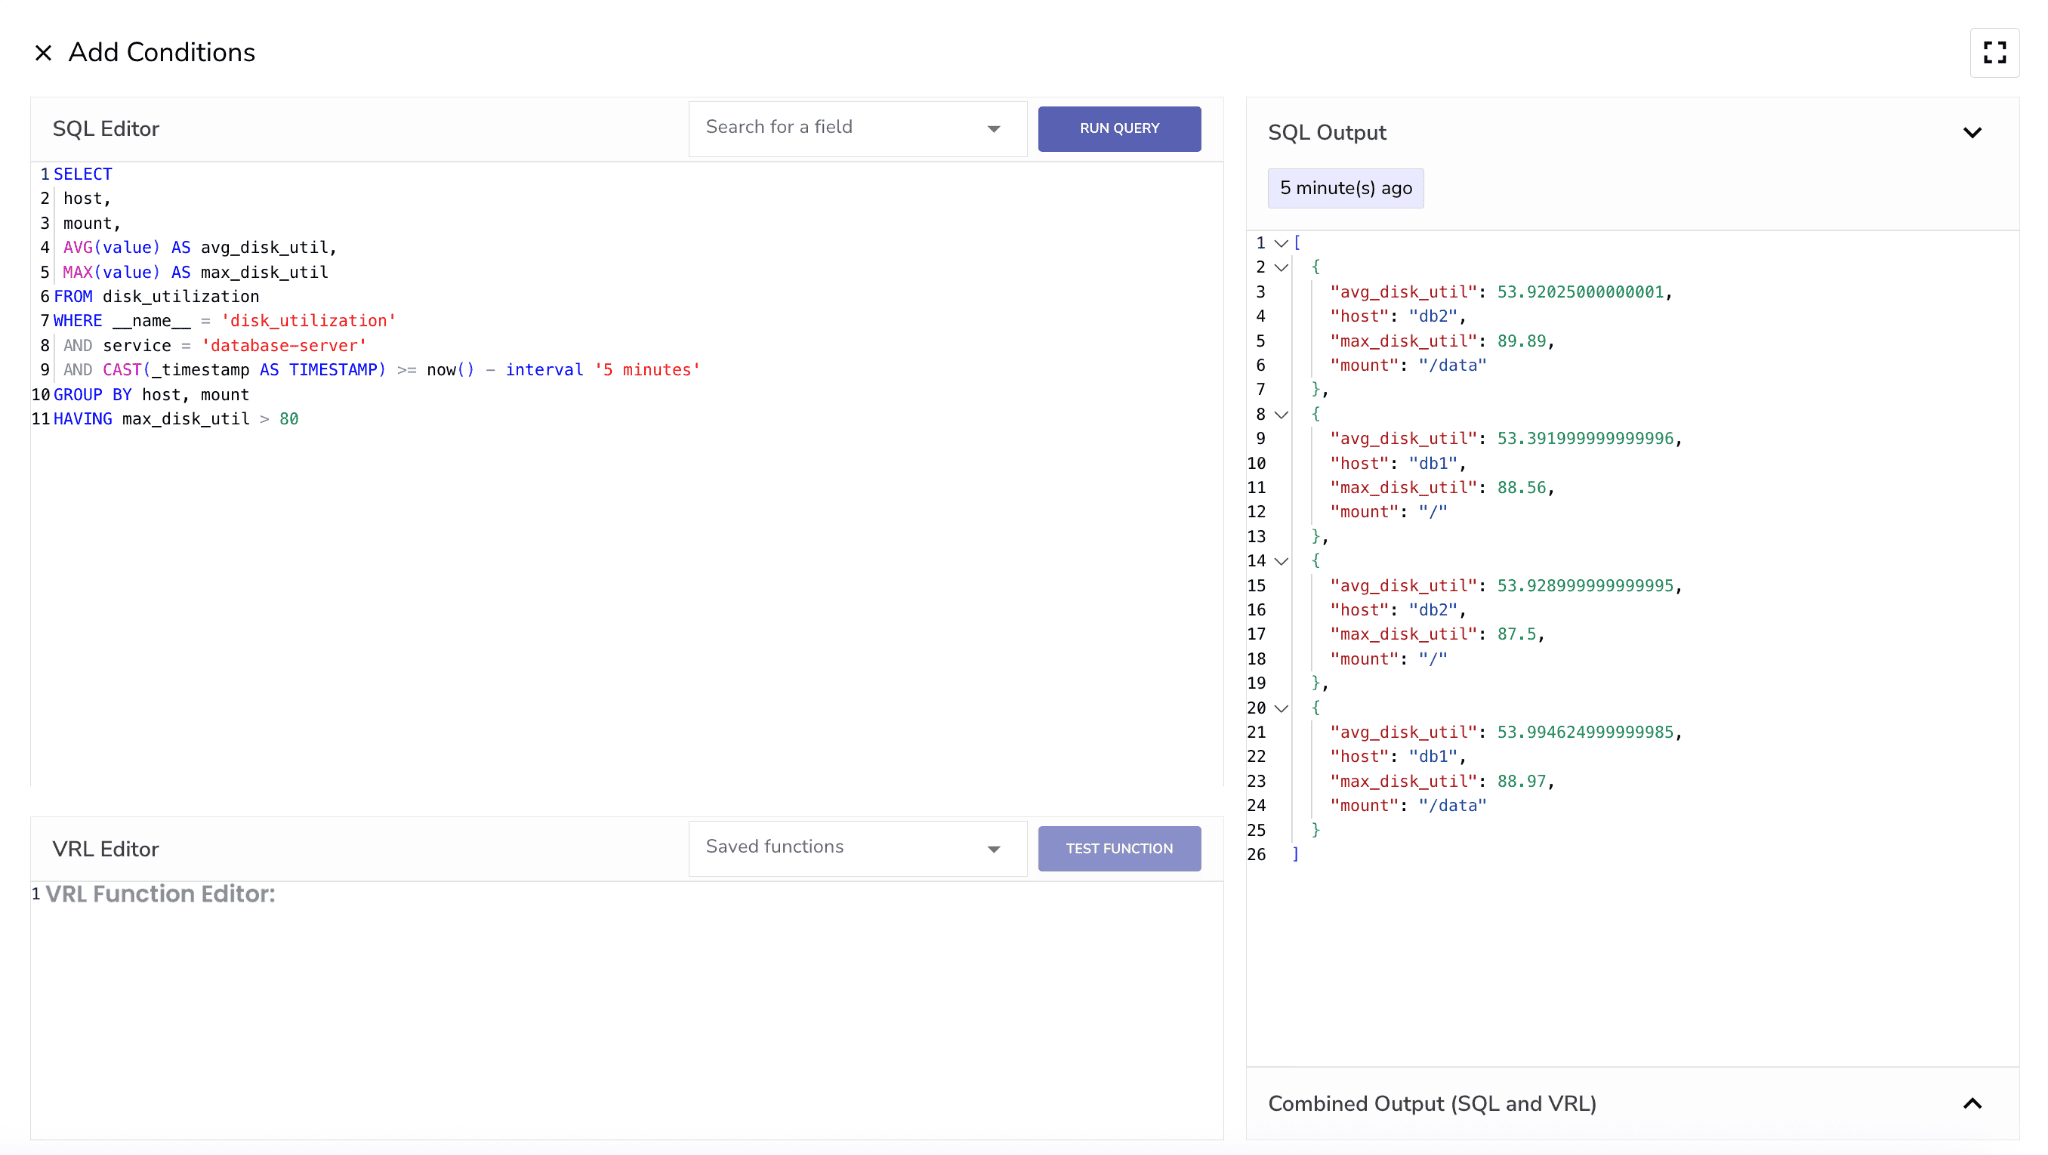
Paste in this query:
SELECT
host,

mount,

AVG(value) AS avg\_disk\_util,

MAX(value) AS max\_disk\_util
FROM disk_utilization
WHERE __name__ = ‘disk_utilization’
AND service \= 'database-server'

AND CAST(\_timestamp AS TIMESTAMP) \>= now() \- interval '5 minutes'
GROUP BY host, mount
HAVING max_disk_util > 80
Why This Query? This helps us: • Identify affected host and mount • Understand both peak and average disk pressure • Filter to relevant service (database-server) • Analyze a stable 5-minute window of recent activity This context is critical—not just for triggering alerts, but for helping you quickly diagnose and respond to potential SLO violations.
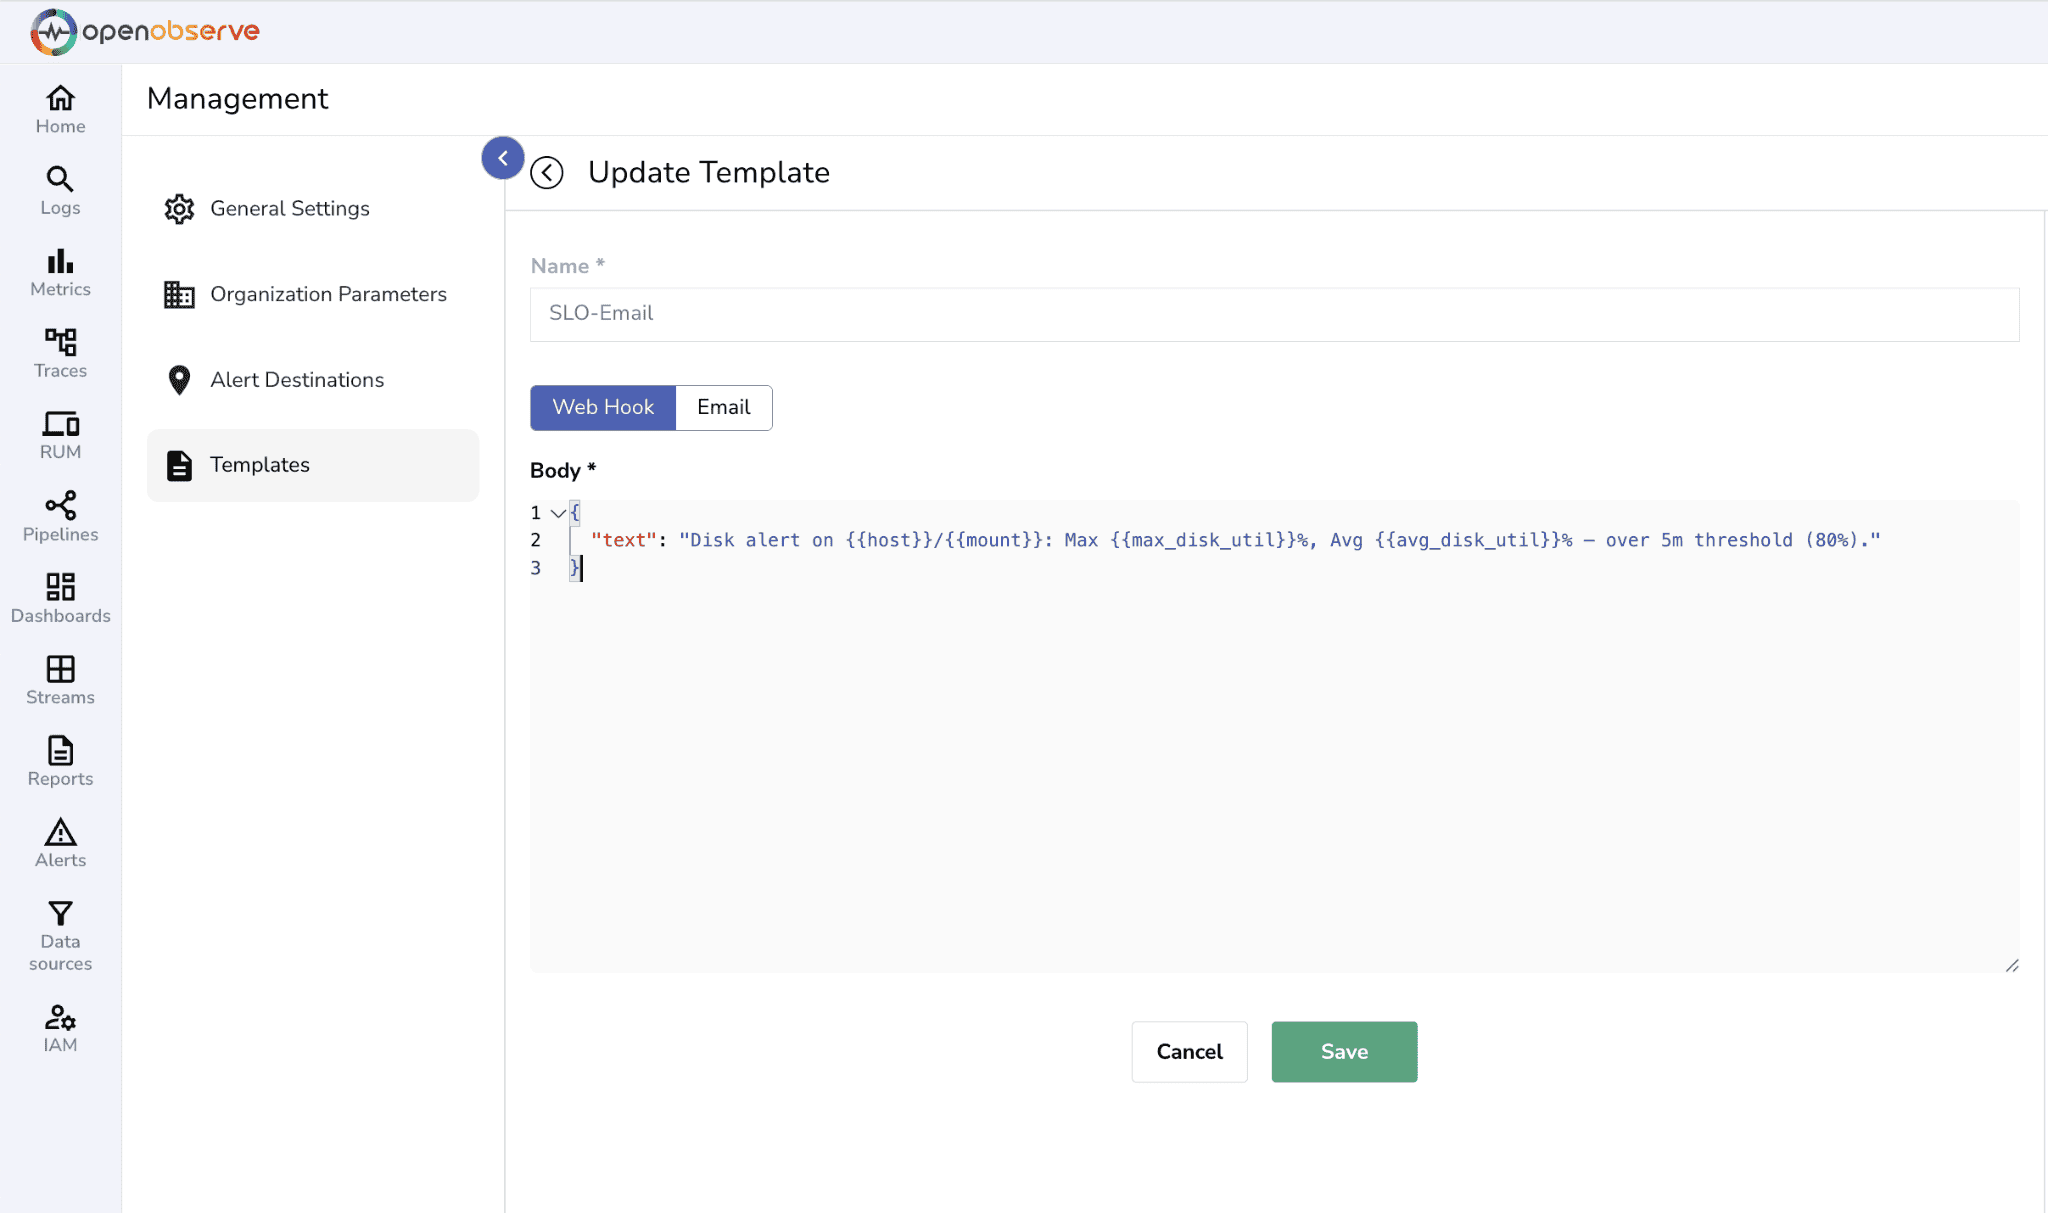
Use the SQL output to enrich the alert message:
{
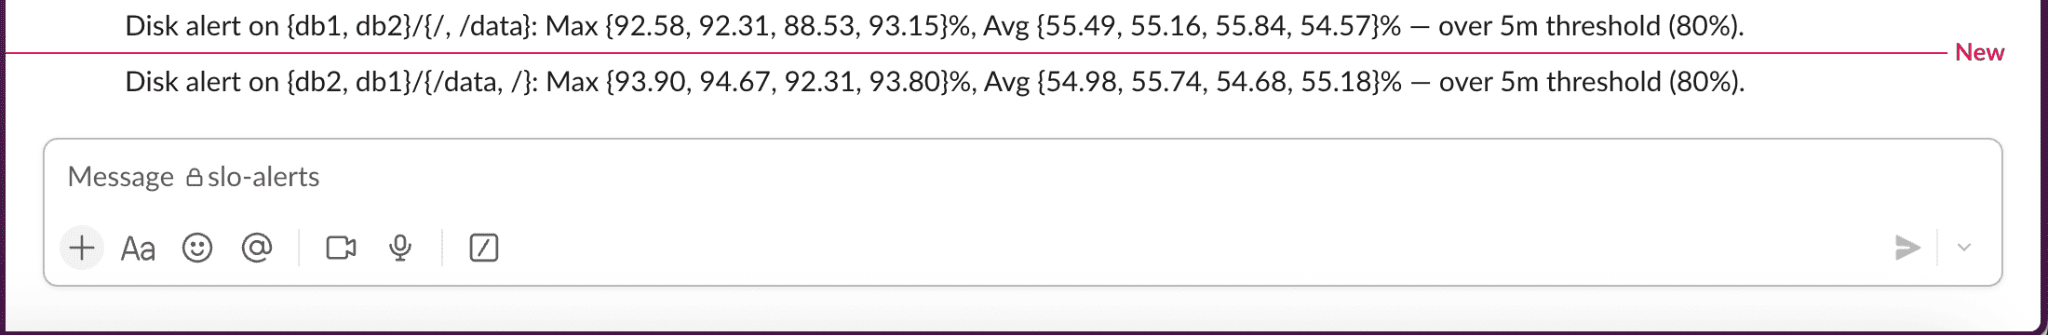
"text": "Disk alert on {{host}}/{{mount}}: Max {{max_disk_util}}%, Avg {{avg_disk_util}}% — over 5m threshold (80%)."
}
• Monitor the alerts page for triggered alerts
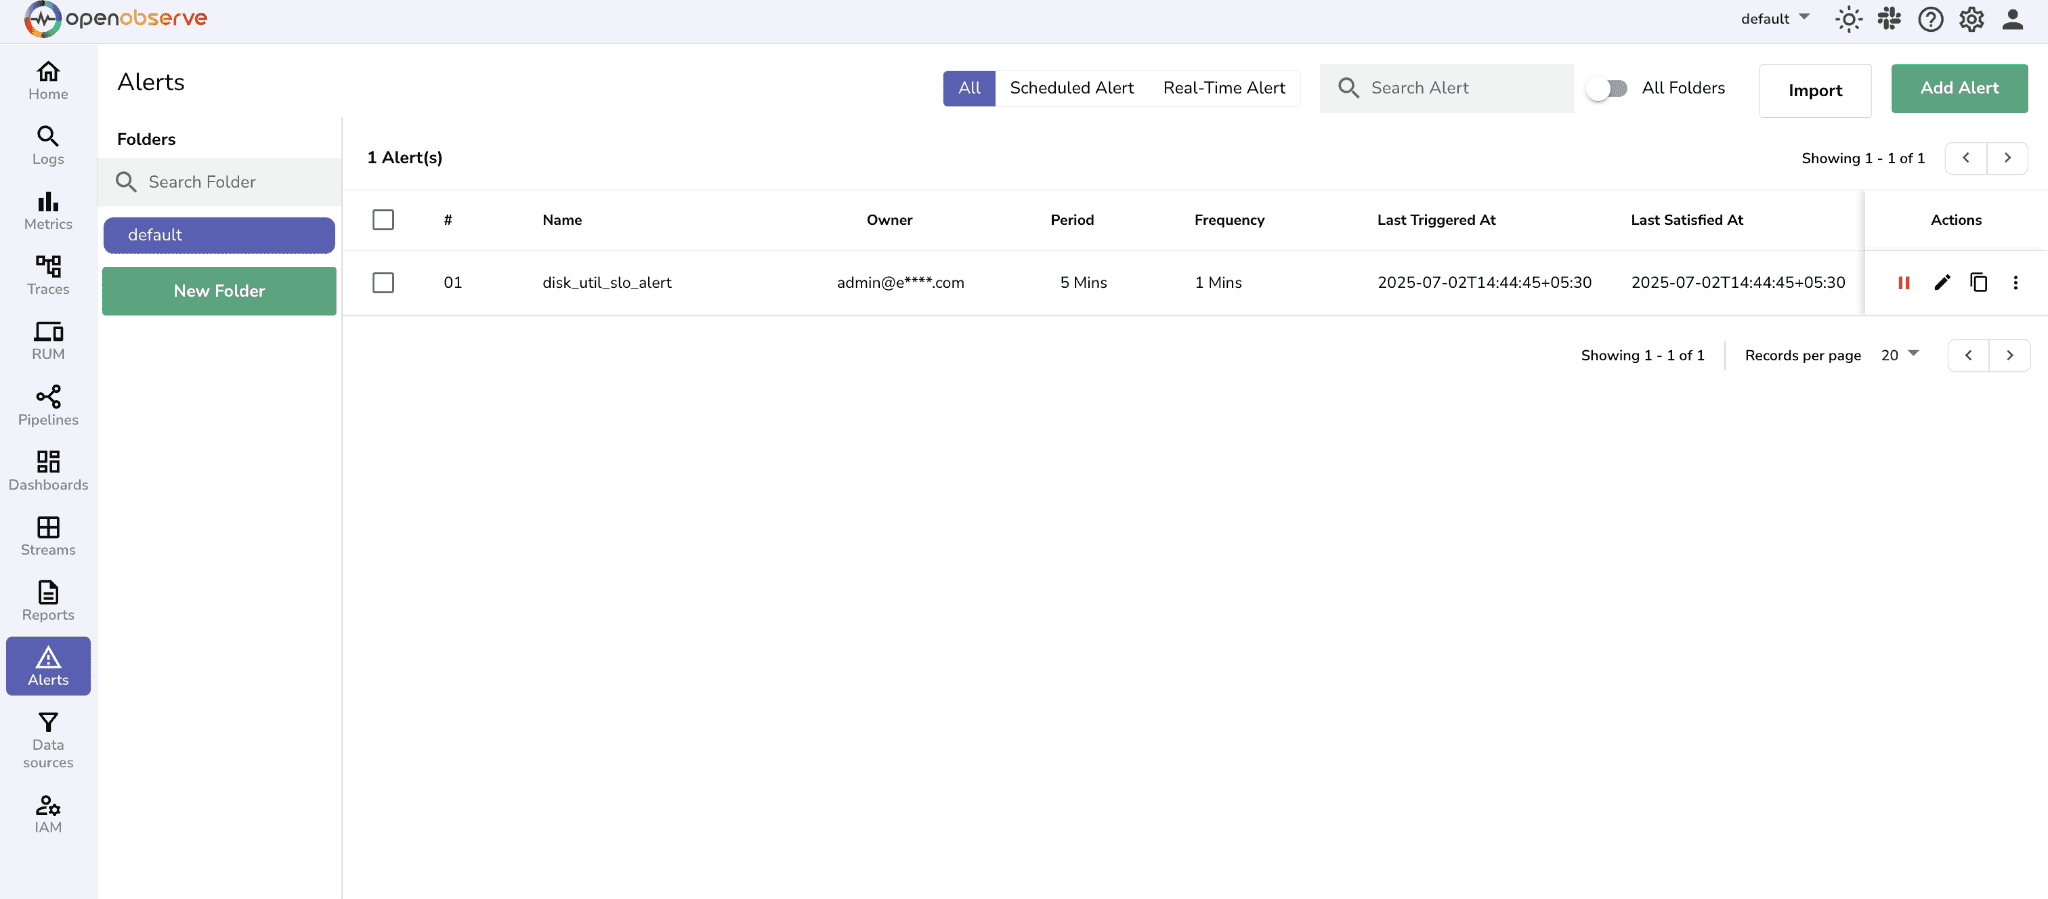 • Test with sample data by Re-ingesting if needed
• Verify notifications arrive in your configured channels
For example a slack notification like this:
• Test with sample data by Re-ingesting if needed
• Verify notifications arrive in your configured channels
For example a slack notification like this:
 Note: We are not firing an alert every time the disk spikes. We alert only when utilization stays high long enough to violate the 5-minute SLO window—avoiding noise from short-lived blips.
Once you’re comfortable with one pattern, you can scale to others. Below are several templates for broader SLO coverage:
SLO: 99% of login requests should complete under 200ms.
Sample Metric Data (__name__ = "login_p99_latency)`:
[
  {
    "__name__": "login_p99_latency",
    "_timestamp": 1751364700000,
    "value": 180.5,
    "service": "auth-service"
  },
  {
    "__name__": "login_p99_latency",
    "_timestamp": 1751364760000,
    "value": 210.2,
    "service": "auth-service"
  }
]
SELECT
  AVG(value) AS avg_p99_latency,
  MAX(value) AS max_p99_latency
FROM default
WHERE __name__ = 'login_p99_latency'
  AND service = 'auth-service'
  AND _timestamp >= now() - interval '5 minutes'
HAVING MAX(value) > 200
Why this query? It checks login latency over the past 5 minutes and raises an alert if any P99 value exceeds 200ms, signaling degraded experience for users.
Message Template:
{
  "text": "Login P99 latency is high — Max: {{max_p99_latency}}ms, Avg: {{avg_p99_latency}}ms. SLO = 200ms"
}
SLO: API error rate must remain under 0.1%.
Sample Metric Data (__name__ = "api_error_rate"):
[
  {
    "__name__": "api_error_rate",
    "_timestamp": 1751364720000,
    "value": 0.03,
    "endpoint": "/v1/users",
    "service": "api-gateway"
  },
  {
    "__name__": "api_error_rate",
    "_timestamp": 1751364780000,
    "value": 0.12,
    "endpoint": "/v1/orders",
    "service": "api-gateway"
  }
]
SQL Query:
SELECT
  endpoint,
  AVG(value) AS avg_error_rate,
  MAX(value) AS max_error_rate
FROM default
WHERE __name__ = 'api_error_rate'
  AND service = 'api-gateway'
  AND _timestamp >= now() - interval '10 minutes'
GROUP BY endpoint
HAVING MAX(value) > 0.1
Why this query? It evaluates API error rates for each endpoint over a 10-minute window, alerting if any endpoint exceeds 0.1% error rate, helping you catch regressions fast.
Message Template:
{
  "text": "High error rate on {{endpoint}} — Max: {{max_error_rate}}%. SLO = 0.1%"
}
SLO: TPS should stay ≥ 500 and success rate ≥ 99.9% during business hours.
Sample Metric Data:
[
  {
    "__name__": "payment_transactions_per_second",
    "_timestamp": 1751364740000,
    "value": 450.0,
    "service": "payment-service"
  },
  {
    "__name__": "payment_success_rate",
    "_timestamp": 1751364740000,
    "value": 99.5,
    "service": "payment-service"
  }
]
SQL Query:
SELECT
  AVG(CASE WHEN __name__ = 'payment_transactions_per_second' THEN value END) AS tps,
  AVG(CASE WHEN __name__ = 'payment_success_rate' THEN value END) AS success_rate
FROM default
WHERE service = 'payment-service'
  AND __name__ IN ('payment_transactions_per_second', 'payment_success_rate')
  AND _timestamp >= now() - interval '5 minutes'
  AND extract(hour from to_timestamp(_timestamp / 1000)) BETWEEN 9 AND 17
HAVING tps < 500 OR success_rate < 99.9
Why this query? It monitors TPS and success rate during business hours only, alerting if throughput or reliability drops below SLO levels. Message Template:
{
  "text": "Payment SLO alert — TPS={{tps}}, Success={{success_rate}}%. Minimums: TPS≥500, Success≥99.9%"
}
} These examples can serve as templates that you can customize for your services and metrics.
When implemented effectively, SLOs drive meaningful improvements across engineering and the business: • Improved customer experience: By measuring what truly matters to users, engineering efforts lead to fewer support tickets, stronger retention, and better satisfaction metrics. • Focused incident response: SLO-based alerting cuts through the noise of traditional threshold alerts, ensuring teams only respond to issues that impact user experience. • Smarter risk management: Error budgets offer a structured way to balance reliability with innovation, enabling faster releases while maintaining service quality. • Organizational alignment: SLOs provide a shared language for reliability, improving collaboration between engineering, product, and leadership on quality and trade-offs.
SLOs aren’t just theory—they’re your best defense against alert fatigue.
By focusing on what users actually care about, and combining that with OpenObserve’s SQL-powered alerting, you can: • Cut down on noisy, one-off threshold alerts • Surface only the issues that threaten real reliability • Empower devs and SREs to share one clear standard of “good enough” • Start small, and scale your SLO coverage as your systems grow
OpenObserve gives you the flexibility to express these goals in code and turn them into actionable alerts.